What you can draw
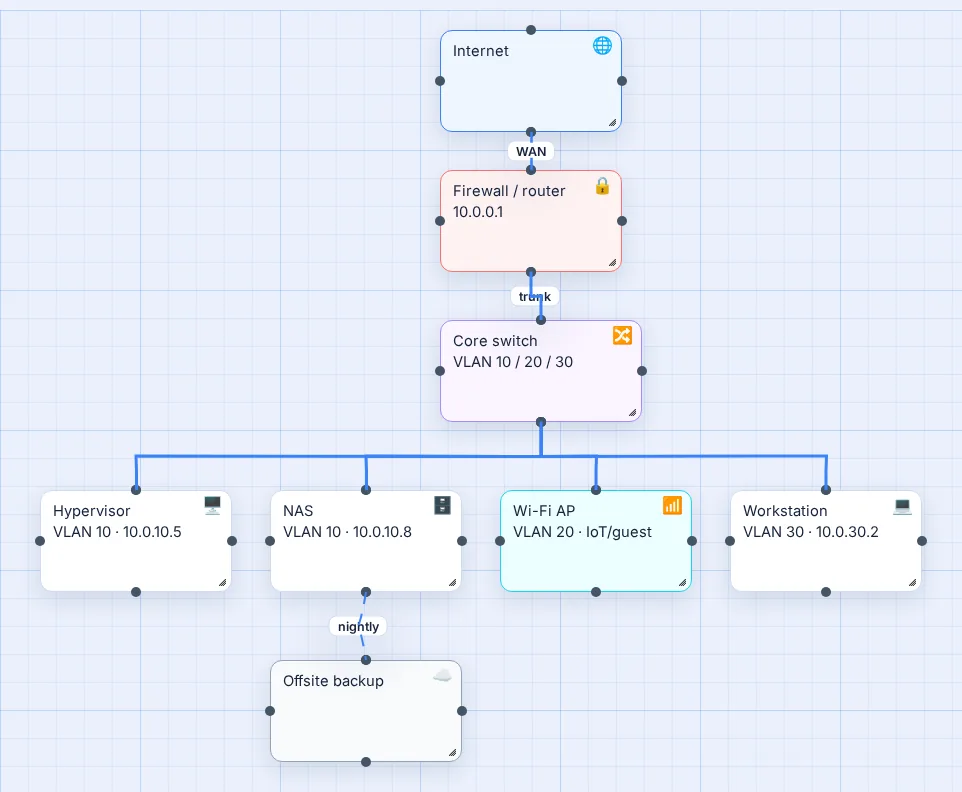
- Home lab diagrams: firewall, core switch, hypervisor, NAS, access points, VLANs and IP ranges.
- Small office networks: ISP link, router and firewall, switches per floor or room, printers, servers, Wi-Fi.
- Home networks: modem, router, mesh nodes and every device. There's a dedicated home network diagram guide with its own template.
- Topology sketches: star, tree or mesh layouts for planning or teaching.
- Before-and-after plans: keep the current network and the planned one as two maps and compare them.
The parts that make it work for networks
| Feature | Why it matters on a network diagram |
|---|---|
| Device icons | Internet, modem, Wi-Fi, switch, desktop, laptop, phone, NAS/server, TV, printer, firewall and cloud, as a tag on any box. |
| Right-angle connectors | The Old School line style draws tidy elbow lines like a rack diagram, instead of curves. |
| Labelled links | Type trunk, Cat6, 10 GbE, VLAN 20 or a port number straight onto a line. |
| Line styles and colours | Solid for wired, dashed for wireless or backup, an animated Circuit style for the WAN, and nine colours for zones. |
| Rich text in boxes | Hostname on the first line, IP and VLAN on the second; bold, lists and links too. |
| Minimap, search, zoom | Big networks stay navigable; search finds a hostname instantly. |
| PNG export and print | Drop the diagram into documentation, a wiki or a ticket. |
| Version history | With a free account, every save keeps a version, so you can see the network as it was before a change. |
How to make a network diagram, step by step
- Pick the view. Physical (hardware and cables) or logical (subnets and VLANs). Do one per map.
- Put the edge at the top. Internet, then your firewall or router. Traffic flows downward from there.
- Add the core. The main switch, or switches, under the firewall. Label the uplink (for example trunk, VLAN 10/20/30).
- Add hosts and access points. One box each, tagged with an icon, with hostname and IP in the text.
- Connect and label. Draw each cable or wireless link and label anything non-obvious: speed, VLAN, port.
- Colour by zone. For example servers blue, IoT teal, guest grey, management red.
- Export. Save a PNG for your docs and keep the live map for the next change.
Network diagram conventions worth following
- Consistent direction. Internet at the top (or left), end devices at the bottom (or right).
- Label every non-default link. If someone would have to ask "what is that cable?", label it.
- Write addresses as ranges on segments (10.0.20.0/24) and as single IPs on hosts with fixed addresses.
- Keep credentials off the diagram. Hostnames and IPs are fine; passwords and keys are not.
- Date it. Put the date in the map title, or rely on version history, so you know how current it is.
Honest limits: Vision Mapr has no vendor stencil packs, auto-discovery or real-time multi-user editing. It's built for one person drawing a clear diagram quickly and for free.
Questions people ask
What is a network diagram?
A network diagram is a picture of how the devices on a network connect: routers, firewalls, switches, servers, access points and end devices, joined by lines that represent cables or wireless links. Good ones also label each link and device with IP ranges, VLANs and port numbers.
What is a network topology diagram?
A topology diagram shows the shape of a network. In a star, every device connects to one central switch. A tree links several stars through a core switch. A mesh connects nodes to each other for redundancy. Most homes and small offices are a star or a tree with the router or core switch at the centre.
What is the difference between a physical and a logical network diagram?
A physical diagram shows real hardware and cabling: which box sits in which rack or room and which port connects to which. A logical diagram shows how traffic is organised: subnets, VLANs, gateways and firewall zones. Keep them as two separate maps once a network grows past a handful of devices.
Is Vision Mapr a replacement for Visio or Lucidchart?
For simple to medium diagrams such as a home lab, a small office or a planning sketch, it covers the essentials free: boxes, device icons, right-angle connectors, labelled links, colours and PNG export. It does not have vendor stencil libraries, real-time co-editing or Visio file import. Use a dedicated diagramming suite if you need those.
Can it discover my network automatically?
No. Vision Mapr is a drawing tool. It does not scan networks or read SNMP; you draw the diagram yourself. That keeps it simple and private, because nothing on your network is ever touched.
Can I draw a project-management network diagram with it?
Partly. Project network diagrams (activity-on-node, PERT) are boxes joined by arrows, so you can draw one, but Vision Mapr does not calculate critical paths or durations. For a visual sketch of task dependencies it works well.